Interactive Mapping & Visualization
Custom interactive maps and geospatial visualizations: analyze, explore, and present your geographic data intuitively.
Interactive Maps
2D Visualization
Dashboards
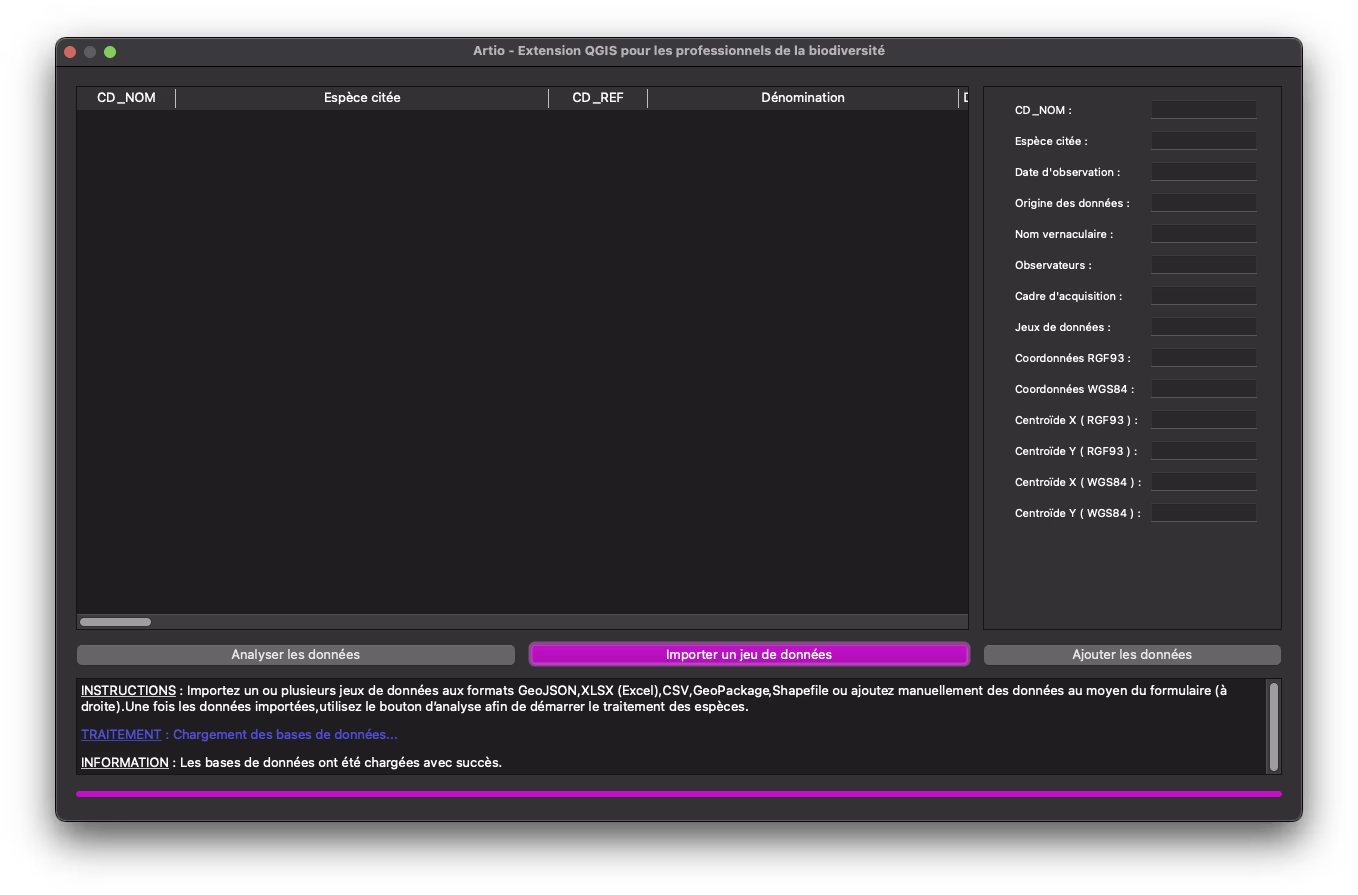
User Interface
95%
Client satisfaction
10+
Maps created
24/7
Updates
100%
Cross-platform compatible
Advanced Visualization Solutions
We design intuitive mapping interfaces and geospatial data visualizations that transform complex information into clear and actionable insights. Our solutions adapt to all sectors and user typesInteractive Maps
Modern mapping interfaces with smooth navigation, dynamic filters and integrated analysis tools
Intuitive navigation
Advanced filters
Measurement tools
Geolocation
2D Visualizations
Dimensional representations for terrain analysis, urban modeling and volumetric data visualization
2D models
Temporal animation
Perspective views
Optimized rendering
Dashboards
Complete interfaces combining maps, charts and indicators for effective project management
Dynamic charts
Automated exports
Visual alerts
Quick Information
Average timeline4-8 weeks
Supported platformsWeb, mobile, desktop
TechnologiesPython, C++, QGIS, Leaflet
SupportTraining included
Need a consultation?Our UX/UI experts and cartographers are available to design the perfect interface for your needsFree Consultation
Frequently Asked Questions
What types of interactive maps can you create?
Are the maps compatible on all devices?
Can we integrate our existing data?
Do you provide training and support?
Ready to visualize your geospatial data?
Let's transform your data together into interactive maps and impactful visualizations that reveal the potential of your geographic information